
Our new enforcement updates will help you:
-
Observe the activity of your parking enforcement agents
-
Note areas that have the most and least enforcement activity
-
Track how many checks or violations occur daily, weekly, and monthly
-
Identify repeat unauthorized occupants or suspicious vehicles
-
Be in control of your parking data
-
Enforce like a boss!
Enforcement Dashboard
All of these updates will appear in the Enforcement Section in the Manager Menu
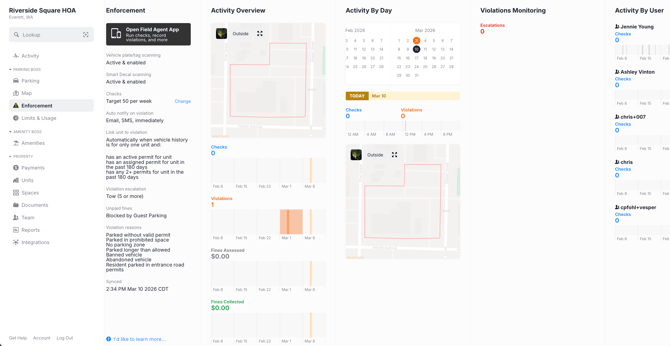
Column 1: Enforcement
Use this section to review your enforcement settings.
You can’t change what you don’t know, so this section clearly details your basic enforcement settings and metrics, such as how many checks should be performed per week, how to notify residents of a violation, and when violations escalate.
Under "Checks" you can update the target number of checks per week.
Column 2: Activity Overview
If you’re curious about the current state of your parking and enforcement, start here with the Activity Overview. A quick glance at this column will reveal the highlights so you know where to dig deeper.
Heat Map
Use the heat map to identify problem areas and track enforcement efficiency.
The new dashboard has a birds-eye view of your property. You can toggle between the default view or satellite view by selecting the icon in the top-left of the map view. At a glance, you’ll notice a few patterns:
-
Blue = checks (anytime a field agent searches a vehicle, parking space, or unit)
-
Red/orange = violations (anytime a violation, warning, or tow is recorded)
-
Hot spots = clusters where a high volume of violations occur
Is enforcement only taking place near the entrance, or does it reach the corners of your property? Do your agents issue violations? Are residents occupying guest zones? If you’re asking those kinds of questions, this heat map will provide the answers you’re looking for.
Checks and Violations
Use these graphs to quickly review enforcement performance and hold your enforcement team accountable.
Below the heat map are graphs with expanded information. The first one details checks. Each vertical bar represents the daily and weekly number of checks, while the horizontal line is a customizable metric for a weekly target. Our team has already set this target based on your community’s size, but you can change that number by contacting our Customer Success team.
The second bar graph includes the same daily, weekly, and monthly information for violations. As a manager, this information clearly describes what your enforcement team is — or isn’t — doing during their patrols. Get the most value from your patrol team by holding them accountable to regular patrols.
Fines Assessed and Fines Collected
These two graphs show when fines were assessed (given) and how many fines have been paid. Some communities attach fines to violations, which is what would show in these two graphs.
Column 3: Activity By Day
Use this section to track the activity of your parking enforcement agents.
Wondering what enforcement took place last night, or last week? The convenient calendar view shows enforcement activity day-by-day.
-
Blue = only checks were performed
-
Orange = checks and violations were performed
-
Blank = no enforcement took place
If you click on a specific date, the checks and violations for that day will appear below the calendar, including the date, time, details, and pictures of each violation.
Column 4: Violations Monitoring
Use this section to review violation data and thresholds.
This section is a list of vehicles that have triggered various violation thresholds. It’s the best place to view your community’s history of violations, including ones that place a vehicle on the boot/tow/fine list.
Escalations
Use this number to understand how many vehicles are receiving repeat violations.
What happens after a vehicle receives a violation that places them on the tow/boot/fine list? It’s recorded as an escalation. This number alerts you to how many escalations have taken place during the specified date range.
Column 5: Activity by User
This section shows you recent activity for both Full Access users who have been active with enforcement and all Enforcement Only users.
Limits & Usage
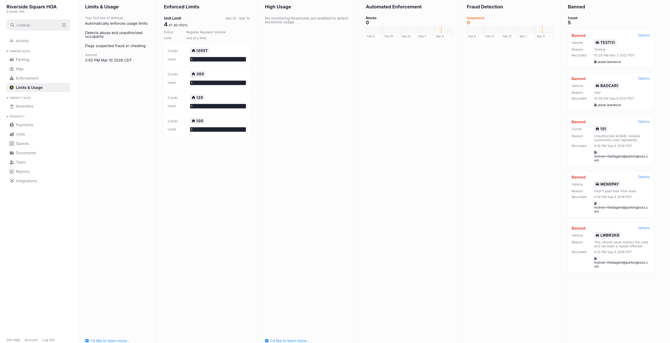
Column 1: Limits & Usage
This column gives a brief overview of Limits & Usage.
Column 2: Enforced Limits
This column shows your unit and/or vehicle limits set in your Parking Attendant. It also displays units/vehicles that are close to reaching the limit.
Column 3: High Usage
Use this column to quickly see how many vehicles are over-parking on your property. We can match this to your per unit limit or set a custom meter.
You no longer have to wonder if someone is storing an extra vehicle in the back of your property or if there are unauthorized residents in your community. This metric tells you how many vehicles are exceeding their parking limits.
Column 4: Automated Enforcement
Use this number to note how many vehicles were denied registration.
Anytime a vehicle exceeds its allotted parking time, enters a wrong passcode, or fails to register, it is flagged here.
Column 5: Fraud Detection
Use this number to identify how many vehicles are flagged as suspicious.
Our advanced software solutions identify the number of vehicles that may be suspicious. This number simply helps you understand if there is any suspicious activity to look into further.
Column 6: Banned
This column shows any vehicles that have been banned by a Full Access user from using any parking.
Feel free to reach out to us at help@communityboss.com with any questions or if you would like to schedule some time to review!